Retail media to drive offline sales
Retail media only works when media investment and attention follow the doors. After several years supporting our partners in growing sales inside retail stores, we created our own planning tool to orchestrate the data points that decide where retail growth actually comes from: where your products are sold, where your buyers live, and where your media is having a real impact. Bringing those signals into one system is what lets us plan for maximum results instead of even coverage.
Your footprint, quantified
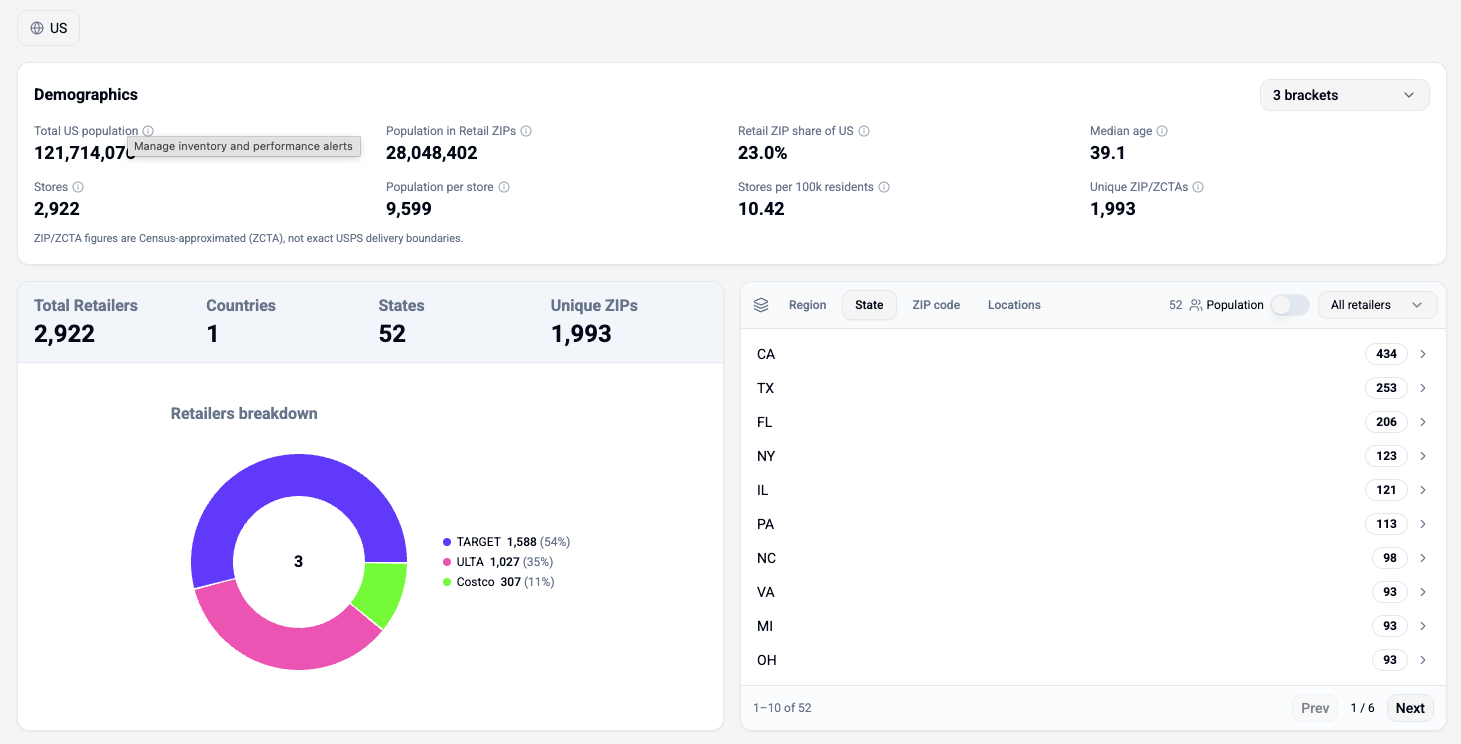
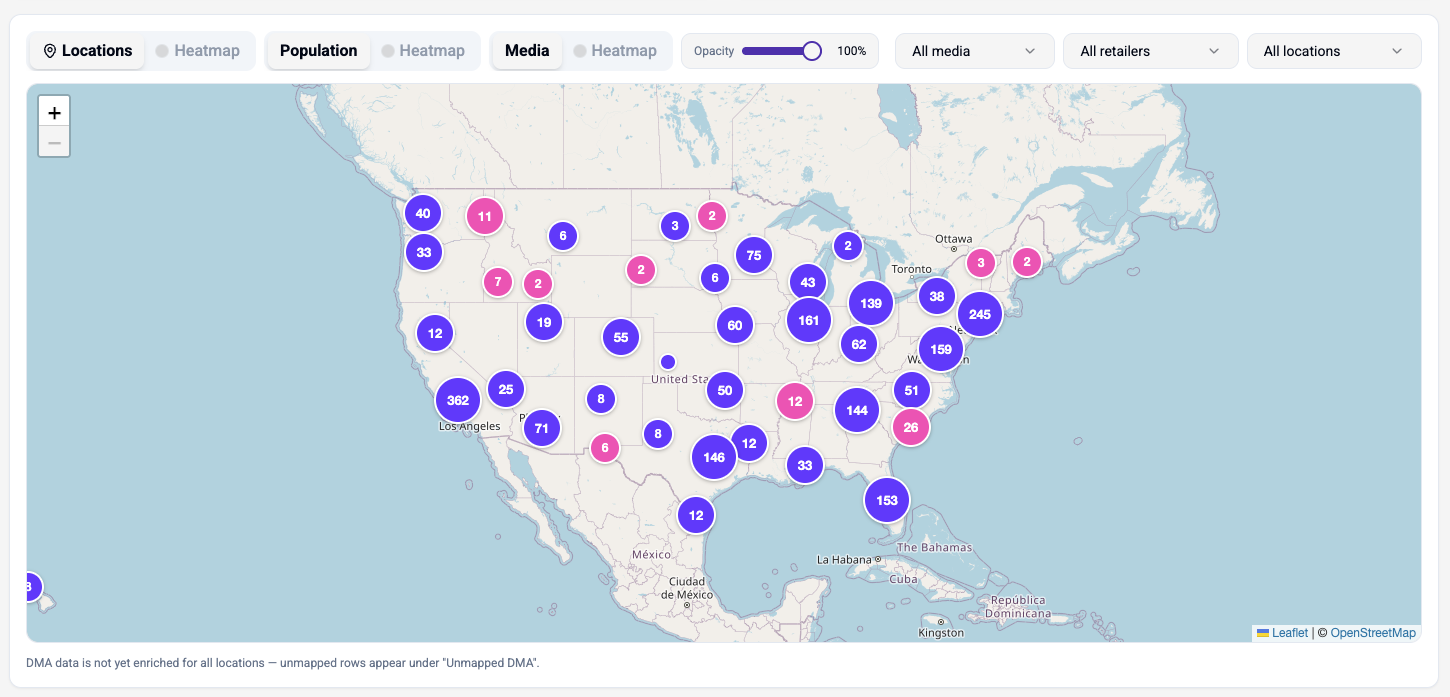
Knowing exactly where every retail location sits changes what a media plan can do. It tells us which trade areas hold enough of your buyers to be worth funding and which doors are currently carrying demand they never get media support for. That precision is what separates a plan built to cover the country from a plan built to sell product in specific stores. The result is media coverage sized to the opportunity in each market, so every retail partner sees support where it can move units and incremental retail revenue comes from the markets most able to deliver it.
Where your shoppers are
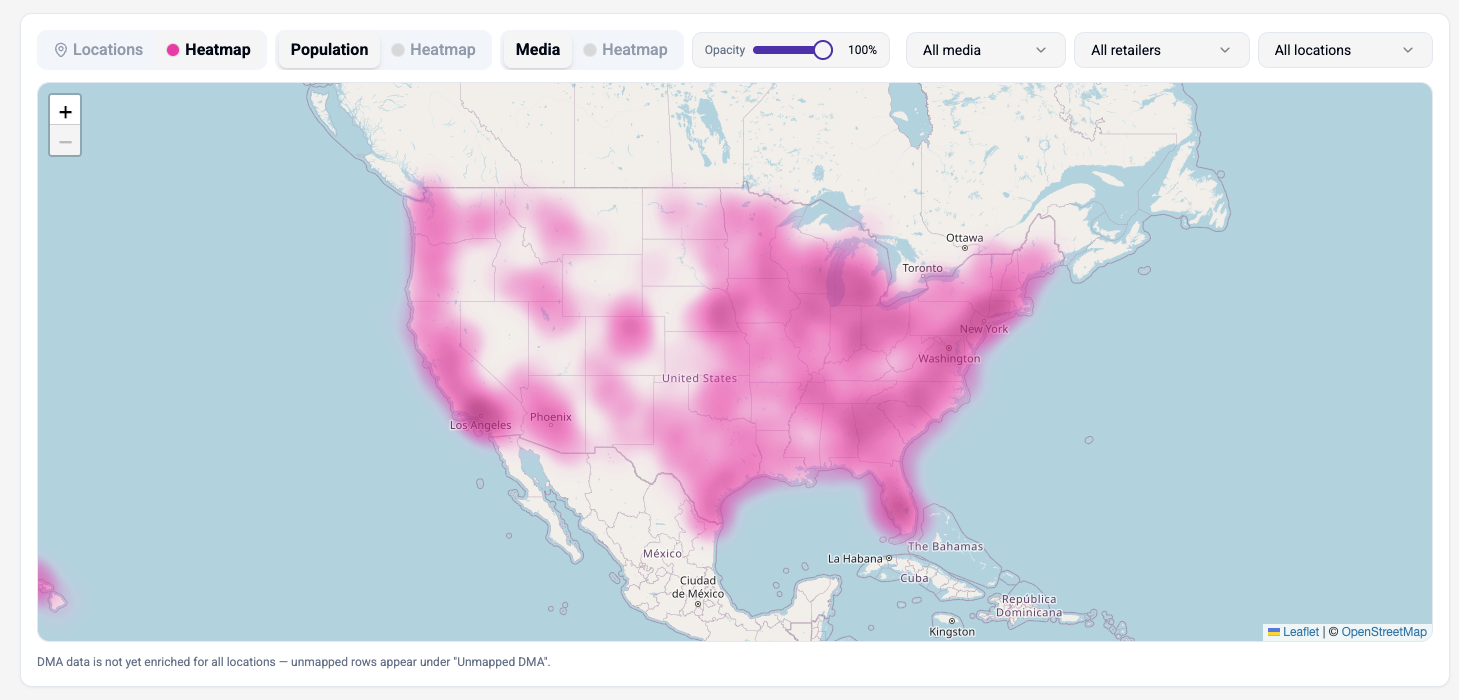
Store count alone does not tell you where the demand sits. We layer population by trade area on top of your footprint so you can see which markets carry real audience weight and which ones look busy on a store map but thin on people.
Where your media is actually going
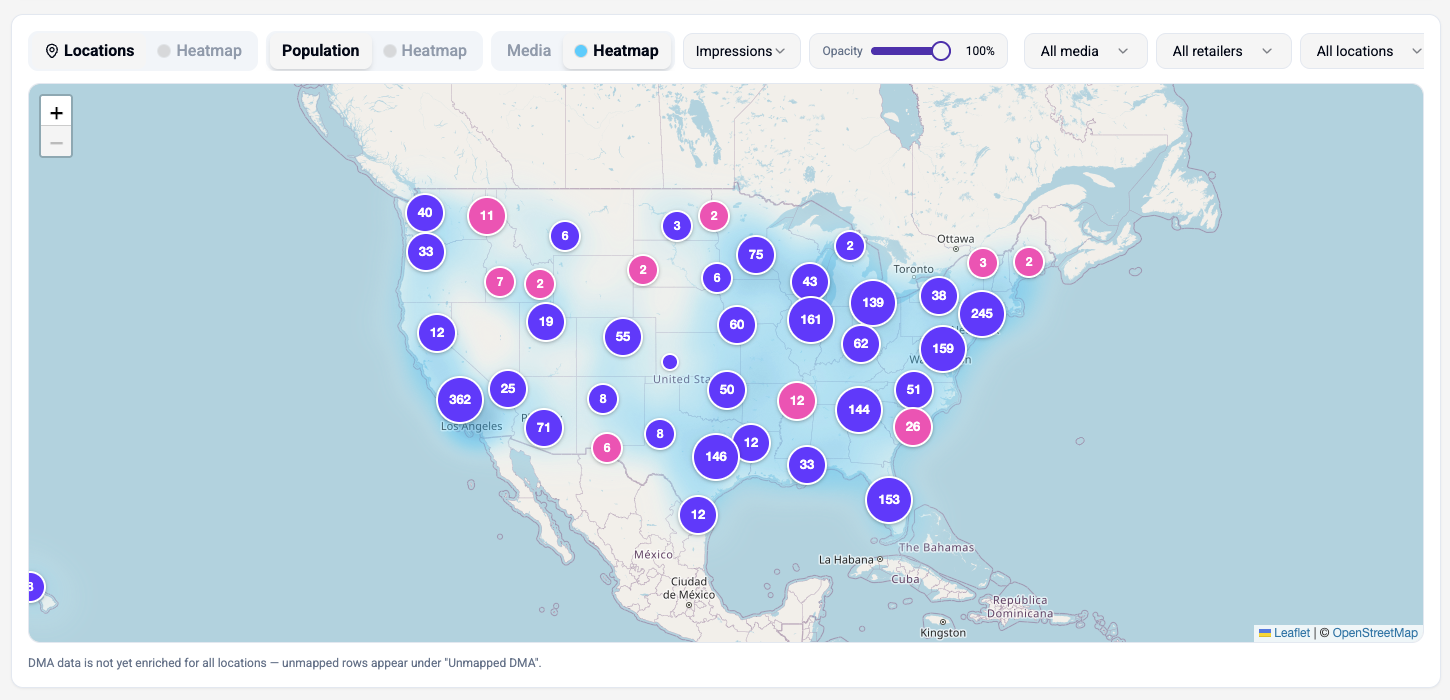
This is the part most brands cannot see. Our technology tracks impressions and clicks by platform and maps them against your store locations, so we can tell whether media is landing in the markets with the retail presence to support it. Not modeled, not estimated at a national level, mapped to the places your products are sold. When spend concentrates in a market with three doors while a 200 door market goes dark, the map shows it before the quarter closes.
Maximum retail support, by design
With footprint, population, and media on the same map, we can plan audience overlap deliberately. Media dollars get weighted toward the trade areas where store density and population both hold up, so spend is supporting foot traffic instead of spreading evenly across markets that do not carry equal weight. Every retail partner sees support where it counts, and no market gets overfed while another goes quiet.
Proving the lift
Once retail sales data is shared with us, we close the loop. We analyze sales performance against media delivery at the market level to identify where lift is tracking with media support and where it is not. Correlation comes first and gets read carefully. To move from correlation toward causation we use geo based testing, holding back or scaling support in matched markets so the sales response can be attributed to media rather than to seasonality, distribution changes, or promotional timing.
Retail media to drive offline sales FAQs
- How few ZIP codes does it take to reach most of my shoppers?
- Fewer than most plans assume. We can tell you how many ZIPs it takes to reach a given share of your target population within a set radius of your stores, and we run it both with and without overlapping trade areas so you are not paying twice to reach the same household. That number is usually the single most useful input to a geo targeting plan, because it turns a national budget question into a ranked list of markets worth funding first.
- Where am I underexposed relative to where my shoppers live?
- This is the gap that quietly costs the most, and it is the question the tool was built to answer. We compare your live impressions and clicks against population and store density by market to find the places where demand and retail presence are both strong but media support is thin. Those markets are typically the fastest source of incremental retail revenue, because the shelf and the shoppers are already in place and only the media is missing.
- Which markets give me the most coverage for the least spend?
- We rank ZIPs by target population reachable, excluding overlapping trade areas, so the list reflects genuine incremental reach rather than the same shoppers counted several times over. It is how we decide where the next dollar goes when the budget will not cover every market at full weight.
- What data is this built on?
- Your own retailer location list, geocoded down to the ZIP, layered with US Census population data (ACS five year estimates) and your live media delivery by platform. No panel estimates standing in for your footprint.
- Can you prove retail media drove in store sales?
- Partly, and we are specific about how. With retailer or syndicated sales data shared with us, we compare sales performance against media delivery by market to see where lift and support line up. Correlation on its own is not proof, so where the budget allows we run geo based holdout and scale tests in matched markets. That is what separates media that looks like it worked from media we can show worked.